7 Infographic Examples You Can Use For Your Business
Infographics can take some extra time to create, but they’re well worth it.
Not only will they help you to diversify your content marketing, but they also have some powerful benefits that you can’t ignore. These include:
- Our brain is able to process visual content 60,000x faster than text.
- 40% of people will respond better to visual information than they will to text.
- People remember 80% of what they see and do but only 20% of what they read.
Too many businesses fail to use infographics because they don’t have a team of in-house designers or knowledge of how to create them. Fortunately, there are tools like Snappa that provide ready-made, fully customizable infographic templates that you can quickly use to create beautiful infographics to accomplish your marketing goals.
In this post, we’re going to take a look at seven different types of infographic examples available through Snappa and how to use them for your business.
1. The Timeline Infographic
No one really wants to read a blog of dates listed one after another like a history book, but the same information becomes incredibly interesting while made visual in an infographic. Our first infographic example is the timeline infographic. The timeline infographic is a great choice for looking at big-picture events, looking at the history of an industry, or even showcasing your brand’s specific story. 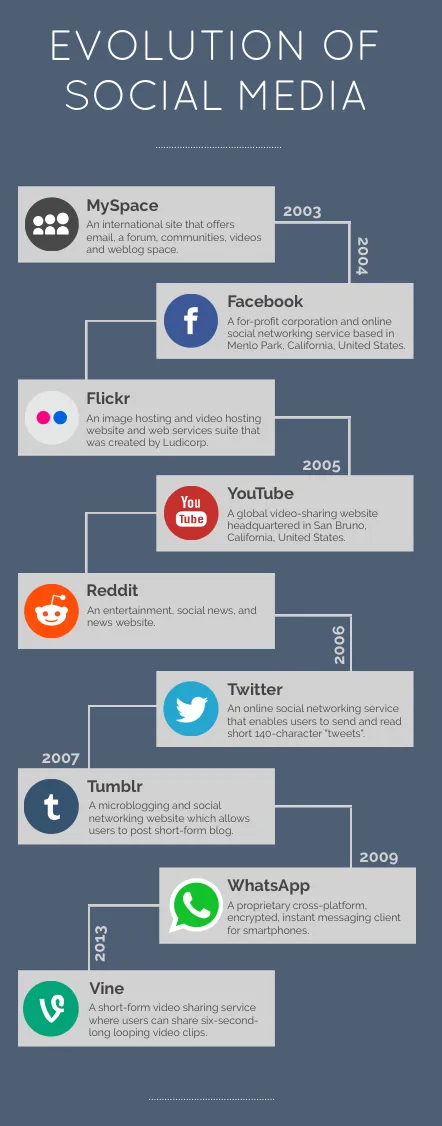
You can use a winding timeline template, like the one above, or use a more linear, single-line approach. Whichever you use, make sure that there’s plenty of clean space, and ideally you should have a line or two for each event explaining its significance.
2. The Checklist Infographic
Checklists are immediately actionable, which makes them valuable and one of the best infographic examples. Want to tell people the steps they need to take when purchasing a home, or even the things they should purchase before moving into said home? You can make checklists about things that people need to accomplish, or things they need to buy.
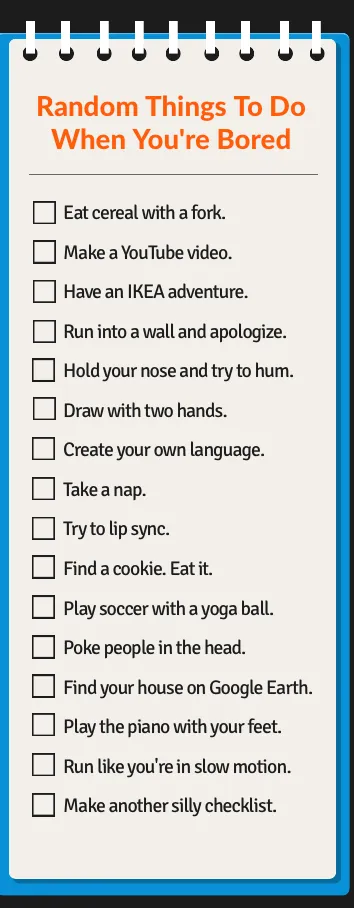
You can actually use checklist infographics as lead magnets, offering them up in exchange for lead information like email addresses or phone numbers. These infographics are incredibly quick to make, and they can yield great results.
3. The How-To Infographic
Like checklists, how-to content is instantly actionable, ensuring that users will derive more value from them and therefore making them more meaningful. How-to infographics can be as specific as you want. You can go over general guidelines, like in the infographic example below or you could get really specific. You could even break down any of the steps in the infographic example below into its own individual infographic or section with more information.
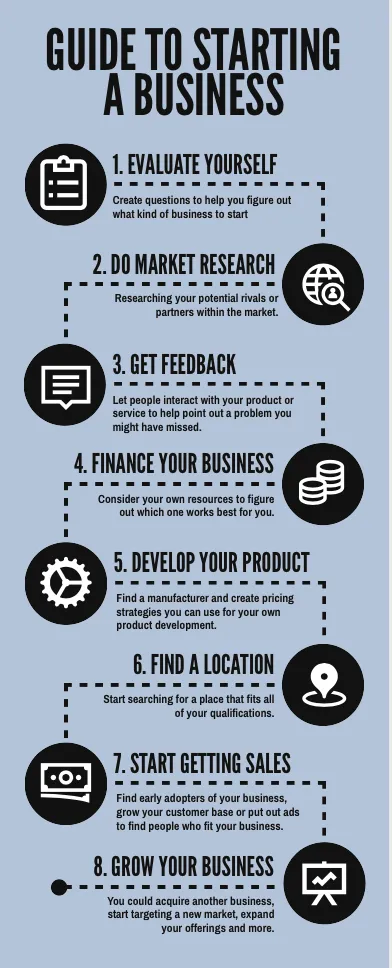
It’s important that you provide as much information as possible in these infographics so that they’re valuable. But you also want to limit the information so that it’s similar to a visual blog post. Keep your sentence structure simple, and opt for just one or two sentences explaining each tip.
4. The Side-by-Side Comparison Infographic
Comparing and contrasting information, products, and misconceptions in a myth vs. fact infographic can make a big impact. The infographic example below quickly portrays “this vs that” data in a way that’s easy for users to read and digest quickly (pun intended).
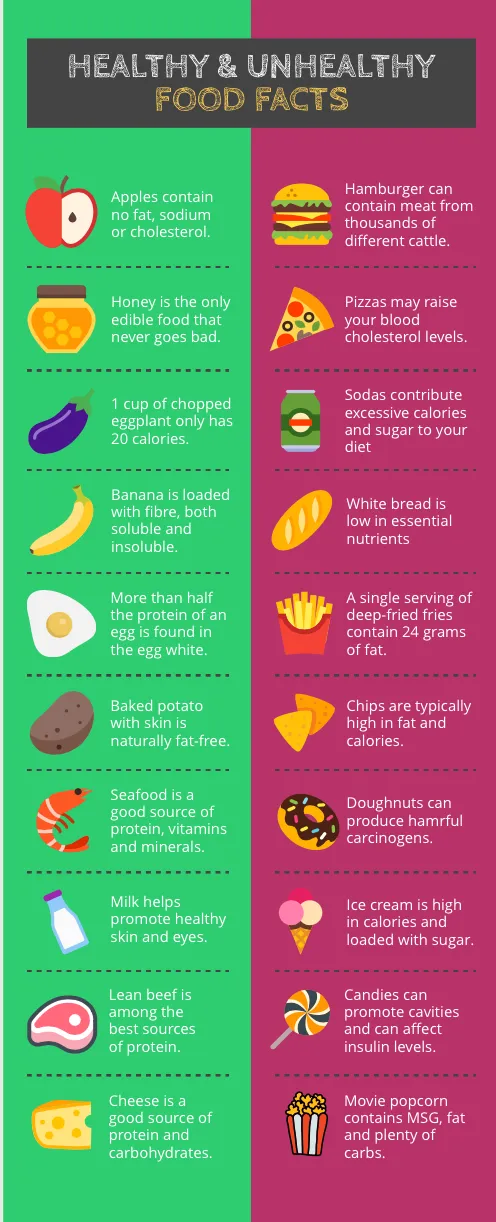
These infographic templates are particularly easy to customize; swapping out the color scheme to match your brand, updating the text, and including new icons (all included with Snappa). This is all that’s needed to quickly create an infographic that demonstrates expertise and shares information with your audience.
5. The Dos and Donts Infographic
The “dos and donts” infographic is similar to the comparison infographic example. There will be a visible split between the two, and they’ll include information that your audience can benefit from. You can explain why certain actions should be taken and why some should be avoided. You can use fear and common mistakes to build trust and demonstrate your expertise amongst your marketing infographics.
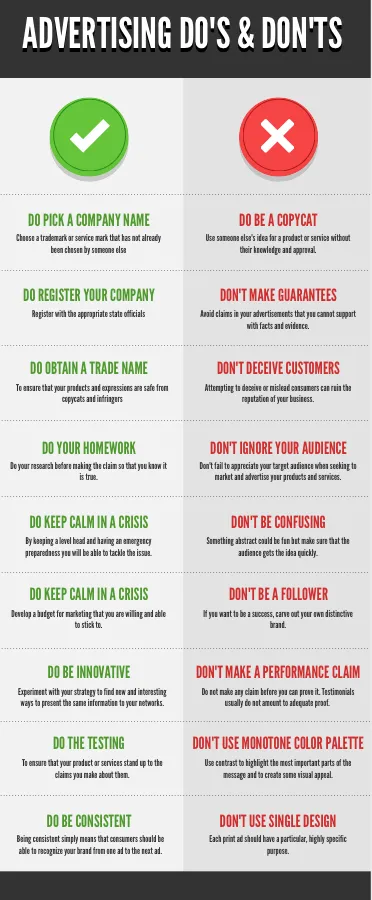
Using visual cues like “green for good and red for bad” can make these infographics easily scannable. Even the change in text can keep you from having to swap out a ton of small graphics while still keeping the infographic overall highly visual, increasing message retention.
6. The Graph & Chart Infographic
You can’t go wrong with fun facts, compiled in a visual way that’s easy to scan. While seeing statistics are great, after, seeing a physical representation in the form of four out of ten people visibly being unemployed like in the business infographic example below is powerful.
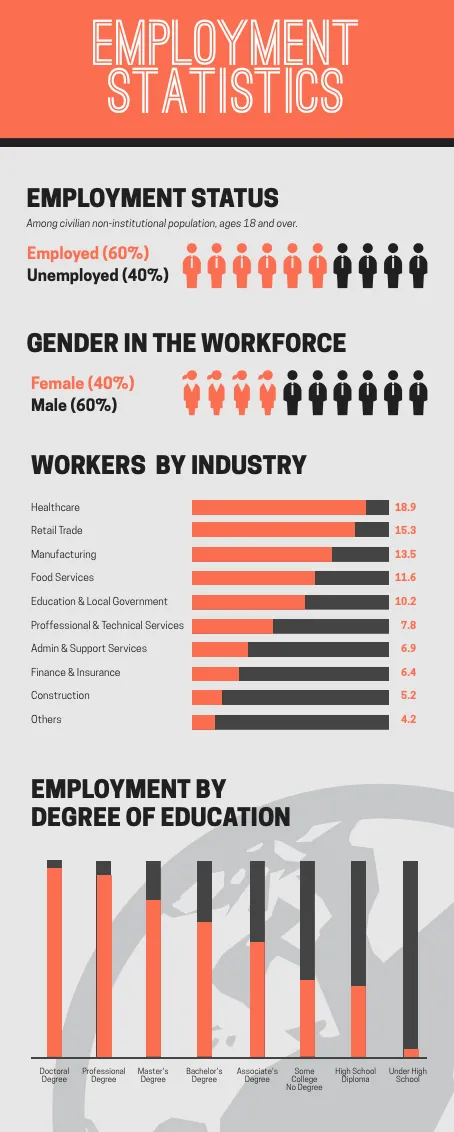
The focus here is all about the graphs and the data. You’re providing an interpretation of data in a hyper-visualized way. This marketing infographic will have more visuals than text, and will be broken down into sections. Include information on or similar to the infographic about how the data was obtained, and credit other sources if necessary. Use a plethora of infographic icons while designing.
7. The Statistic Infographic
Sometimes, you just have a list of information or facts that you need to distribute quickly. You don’t necessarily want to take a significant amount of time to customize an infographic. If that’s the case, look at a statistic infographic template like the example below. This infographic example uses different color blocks to section off different marketing statistics.
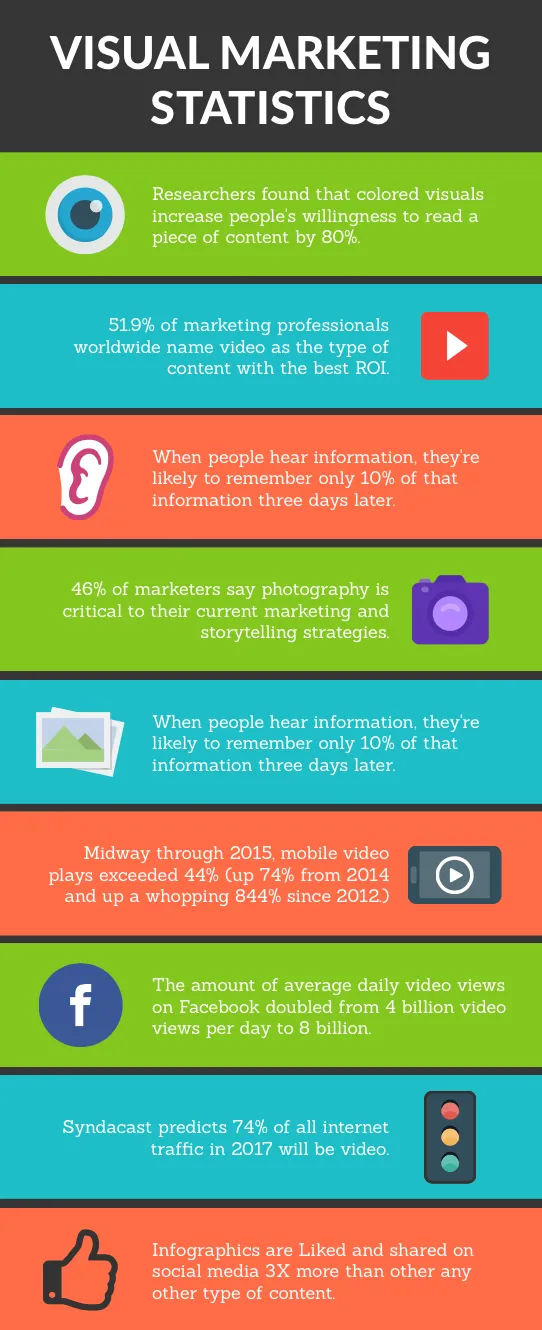
If you’re sharing information that all falls under a similar category instead of breaking it down into distinct sections, this is a good alternative. Customize the infographic text as needed. Look for some of the preloaded infographic icons we have available in Snappa to add small visual elements that will make a big impact.
Infographic Best Practices
If you want to use infographics for marketing, having pre-made infographic templates will make your job significantly easier. To increase success further, we’ll share a few infographic examples, best practices, and design tips.
Best practices include:
- Keep it simple. While infographics share a lot of information in a visual way, you don’t want to get too over the top. Ensure that there’s plenty of white space in the infographic so that it’s still easy to scan and digest.
- Get to the point. Infographics are not blog posts. Sentence structures should be simple. You should only include as much text as is necessary to establish context and provide value. Remember that if you want to go in-depth, you can create a blog post surrounding the infographic to elaborate more.
- Focus on a cohesive color palette. Too many colors on a single canvas is a common design flaw; it contributes to the cluttered feel you want to avoid and can make it unpleasant to view. It’s better to choose a cohesive color palette, which may include contrasting colors for emphasis. If you can ensure that the colors match your branding, even better.
Conclusion
Infographics should be an important part of your marketing campaigns. They’ll help you to diversify your content and social media marketing while also creating original, highly sharable content that both your audience and your peers are likely to share. Whether you use them to get some extra social shares or to generate new leads, these easy-to-use, customizable infographic templates will help you create a high quality visual product that will leave a lasting impression. Use our infographic examples as a guideline and create some amazing infographics to share!
Ready to make customized infographics for your audience? Start your free trial with Snappa today.
What do you think? Which of these infographic examples are your favorite? How do you get the best results with the infographics you create? Share your thoughts and questions in the comments below!